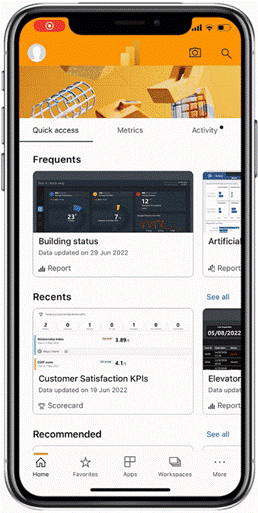
We live in a
connected world and almost everything around us generates data. Imagine if you
could view that data, processed and with insights, in the context where it was
created. Now, with Power BI Mobile app, you can.
Data in space is a new Power BI Mobile feature
that uses augmented reality to create spatial anchors in the real world and
attach Power BI data t so that data can be connected to the physical
environment it describes.
Use Data in space, to connect
business data to real-world scenarios, such as facility management,
manufacturing, or retail.
Azure spatial
anchors technology enables the app to understand spaces, mark specific places
of interest, and remember those points of interest. It then allows the app to
search a space and look for anchors created in that space.
By using the Azure Spatial Anchors
service, we’ve made it possible for one device to read a spatial anchor created
in a space by another device, thus making for a real cross-device experience.
Later this year we’ll release Data in space support for Android, which will
enable a cross-platform experience, effectively making it possible for everyone
in an organization to participate in the Data in space experience.
To enable Data in Space, Power BI
Administrators need to create an Azure Spatial Anchors resource in their Azure
subscription and connect it to their Power BI tenant. They then need to assign
users to roles that will allow them to save and search for Azure spatial
anchors in the relevant locations. Learn more about how to set up Data in space.
Users in the organization will then get
Data in space experiences based on the role they got from the admin:
- Pin in space: The ability to create and save
anchors with Power BI data.
- Scan
space: The ability to search and discover anchors around you.
Think about a facility management
scenario, where you, as a building manager, can pin reports showing the status
of various areas in the building as collected from multiple sensors and data
sources, such as air quality, temperature, floor occupancy, etc. Later, these
reports can be discovered by the building attendant or by the building
operations staff when visiting that area, simply by using their Power BI Mobile
app.
Create an anchor and pin data to space
Select the report to pin and to set up the
desired state choose filters and apply slicers.
Once the view to pin
is ready, select Data
in space from the report header, check to see that the
preview view reflects what you set up, and then open the camera.
Pin the same report multiple times, with
different filters. For example a single Panels health report that can be
filtered for several specific panels. Pin it next to each panel with a
different filter applied. The app will store the filter used when pinning and
will apply it r when you (or others) discover it later.
Open the camera, to see your view in the
real-world, cand hoose where exactly to place it, and scale it as desired.
Learn more about pinning reports to space
How to discover anchors and data around you
Open the camera from your app’s homepage.
When Data in space
is enabled for you, the camera will scan for data around you by default.
The report locator
at the bottom of the screen will indicate when anchors are found, and help you
to direct the camera to the right direction.
The preview image you see on the card
shows the latest Power BI data and also reflects the permission you have on the
data.
Learn more about discovering pinned data


No comments:
Post a Comment
if you have any doubts, please tell me